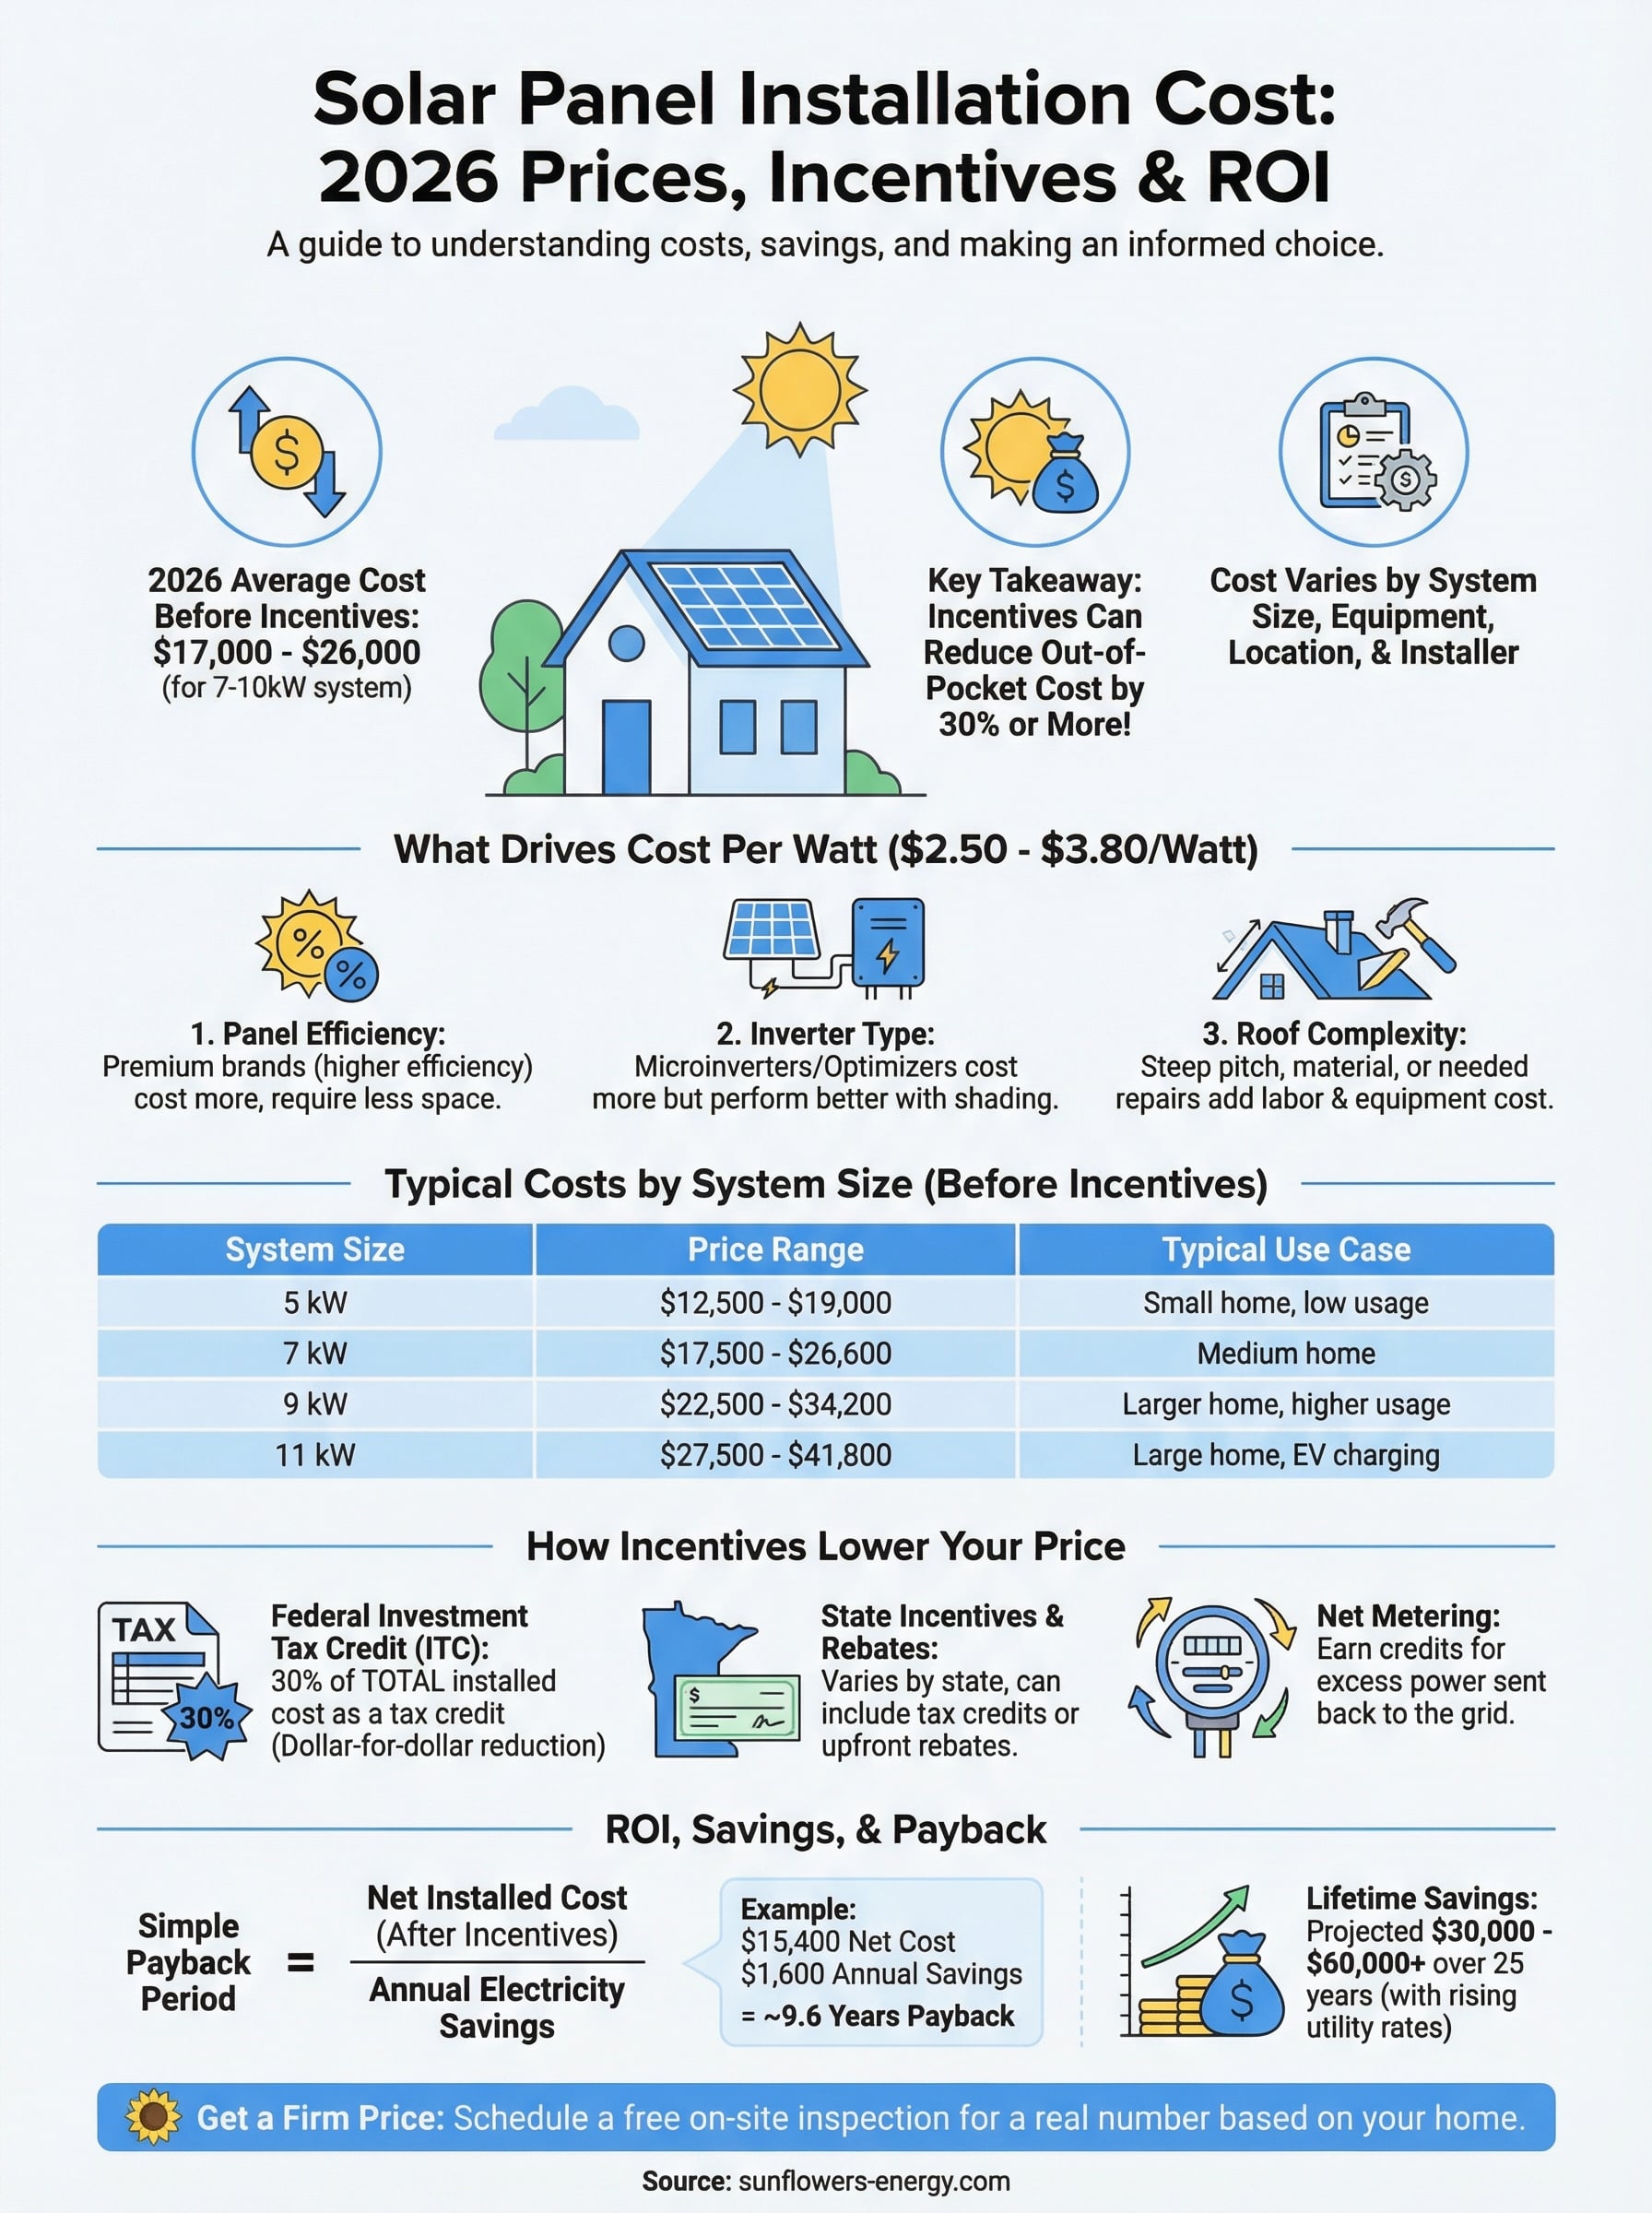
The average solar panel installation cost in 2026 sits between $17,000 and $26,000 before incentives, a range wide enough to make any homeowner pause. That price tag depends on your system size, equipment choices, where you live, and the installer you work with. But here’s what most quotes won’t tell you upfront: after the federal solar tax credit and state incentives, your actual out-of-pocket number could drop by 30% or more.
At Sunflowers Energy LLC, we handle both roofing and solar installations, which gives us a ground-level view of what these projects actually cost, not just what industry reports estimate. We see the invoices, the material prices, and the incentive paperwork every week. That hands-on experience shapes everything in this guide, and it’s why we break costs down with real pricing benchmarks rather than vague ranges. Our goal is to help you walk into any solar decision with clear, accurate numbers.
This article covers average total system costs, price-per-watt figures across different states, a full breakdown of the federal tax credit and other financial incentives, and how to calculate your return on investment. Whether you’re comparing quotes or just starting your research, you’ll leave with the specific cost data you need to make a confident, informed choice about going solar.
Why solar panel installation cost matters
When you see a price range like "$17,000 to $26,000," it’s easy to treat it as background noise. But solar panel installation cost is the single number that determines whether solar makes financial sense for your household, how you’ll pay for it, and how long it takes to break even. Getting this number right, before you sign anything, shapes every decision that follows.
The decision is bigger than just the panels
Most homeowners frame solar as a product purchase, but it’s more accurately a long-term financial commitment. The panels themselves are only part of what you’re paying for. Your quote also covers the inverter, mounting hardware, wiring, permits, inspections, and labor. Each of those line items varies by contractor, region, and your specific roof setup. A quote that looks low on the surface might be cutting corners on equipment quality or excluding permit fees that appear later as surprise charges.
The total installed cost, not the panel price alone, determines how quickly your system pays itself back.
Understanding the full cost also helps you compare quotes accurately. If one installer quotes $20,000 and another quotes $24,000, the difference might reflect equipment quality, warranty length, or labor standards rather than one company simply charging more. You can’t evaluate those differences without knowing what each number actually includes.
How cost affects your financing options
Your total system cost directly changes which payment options are realistic for you. A $22,000 system paid in cash versus financed over 12 years produces very different monthly savings numbers. Solar loans, leases, and power purchase agreements each carry their own terms, and the interest or fees attached to them can meaningfully reduce your net savings over the life of the system. Knowing your actual installed cost upfront lets you run those comparisons with real figures instead of guesses.
Financing also ties directly into the federal solar tax credit, which currently covers 30% of your total installation cost. If your system costs $20,000, that’s a $6,000 credit applied directly to your federal tax bill. But if you don’t understand your full cost going in, you could underestimate the credit amount and miscalculate your actual out-of-pocket expense. That error affects your loan sizing, your monthly payment, and your payback timeline all at once.
Why accurate cost data protects you
Homeowners who enter solar consultations without a solid grasp of real market pricing are more likely to accept overpriced quotes. Some installers will price according to what the market will bear, and a customer who hasn’t done their homework is an easy target. Walking in with current benchmarks, such as price-per-watt figures and average system costs for your state, puts that dynamic back in your favor.
Accurate cost data also prevents the opposite problem: chasing the lowest bid without understanding why it’s low. Underpriced quotes often signal lower-tier equipment, inexperienced crews, or excluded permit and inspection fees that surface later. Both scenarios, overpaying and underpaying for the wrong reasons, lead to regret and reduced long-term savings. The sections below give you the specific numbers and benchmarks you need to avoid both.
Average solar prices in 2026
In 2026, the national average solar panel installation cost runs about $3.00 per watt before incentives. For a typical home requiring a 7- to 10-kilowatt system, that puts the total installed price between $17,000 and $30,000. Most households fall somewhere in the middle, with 8kW systems being the most common size for a moderately sized home with average energy consumption.
Typical costs by system size
Your home’s electricity usage determines the system size you need, which directly sets your total cost. A smaller home with modest energy use might work well with a 6kW system, while a larger home running central air, an EV charger, or a home office typically needs 9kW or more. The table below shows what you can expect to pay at current 2026 pricing, before applying any federal or state incentives.

| System Size | Price Range (Before Incentives) | Typical Use Case |
|---|---|---|
| 5 kW | $12,500 – $19,000 | Small home, low usage |
| 7 kW | $17,500 – $26,600 | Medium home |
| 9 kW | $22,500 – $34,200 | Larger home, higher usage |
| 11 kW | $27,500 – $41,800 | Large home, EV charging |
These figures reflect fully installed costs, meaning they include panels, inverter, mounting hardware, wiring, permits, and labor. A quote that excludes any of those components will look artificially low on paper and cause unpleasant surprises later.
How location shifts your price
Where you live has a real effect on what you’ll pay. Labor rates, local permit fees, and utility interconnection requirements all vary by state, and those differences show up in your final invoice. States like California and Massachusetts tend to run higher due to stricter permitting processes and elevated labor costs. Meanwhile, states like Texas and Florida often land closer to the national average because of simpler interconnection procedures and more competitive installer markets.
Your state’s average price per watt can differ by $0.50 or more from the national figure, which adds up to thousands of dollars on a full system.
Roof type and condition also shift your labor cost regardless of location. A straightforward installation on a newer, accessible roof costs less than one requiring extra mounting hardware or structural reinforcement to support the added weight.
What drives your cost per watt
The national average of $3.00 per watt is a useful benchmark, but your actual price per watt can land anywhere from $2.50 to $3.80 depending on the specific choices you make and the conditions on your property. Understanding what pushes that number up or down helps you evaluate every line item in a quote and identify where spending more actually pays off in the long run.
Panel brand and efficiency rating
Panel manufacturer and efficiency rating are the two factors that most directly influence your per-watt cost. Premium brands like SunPower or REC Group charge more because their panels convert more sunlight into usable electricity per square foot. That higher efficiency matters most when your roof has limited space or partial shading, because you get more output from fewer panels. Budget-tier panels cost less upfront but may require more panels to hit your target system size, which adds labor and mounting hardware back into the equation and can erase the initial savings.
Inverter type
Your inverter choice also moves your solar panel installation cost in a meaningful way. String inverters are the least expensive option and work well on roofs with consistent, unobstructed sun exposure. Microinverters and power optimizers cost more per watt but pay off when your roof has multiple angles or trees that cast intermittent shade, since they let each panel operate independently rather than dragging down the output of the entire array. The right inverter type depends on your specific roof layout, not just your budget.
Choosing the wrong inverter type for your roof conditions can reduce your system’s annual output by 10 to 20%, which extends your payback period significantly.
Roof complexity and installation conditions
Roof pitch, material, and condition all affect how long your installation takes and how much additional equipment is required. A steep roof requires more safety rigging and slower progress, which drives up labor costs directly. Tile and metal roofs need specialized mounting brackets that add both material costs and installation time. If your roof is approaching the end of its useful life, replacing it before installing solar is worth factoring into your total budget, since removing and reinstalling panels for a future roof replacement will cost considerably more than handling both projects at the same time.
How to estimate your total installed cost
Getting a rough cost estimate before you call an installer gives you a useful baseline number. You don’t need specialized tools or industry knowledge to do it. Three inputs get you a working figure: your monthly electricity consumption, the current price per watt in your area, and a few property-specific factors that push the final number up or down.
Start with your monthly electricity use
Your electricity bill shows your monthly kilowatt-hour (kWh) usage, typically printed near the top or in the usage history section. Find your average monthly kWh figure and multiply it by 12 to get your annual consumption. A typical U.S. home uses around 10,500 kWh per year, but your number may be higher or lower depending on your appliances, square footage, and climate. This annual figure tells you how much energy your solar system needs to produce to meaningfully offset your bill.
Sizing your system 10 to 15% above your annual usage is a common buffer that accounts for panel degradation over time and seasonal production dips.
Convert your usage into system size
Once you have your annual kWh number, divide it by a production estimate of 1,200 to 1,400 kWh per installed kilowatt. That calculation gives you your target system size. The table below shows how this plays out at a few common usage levels.
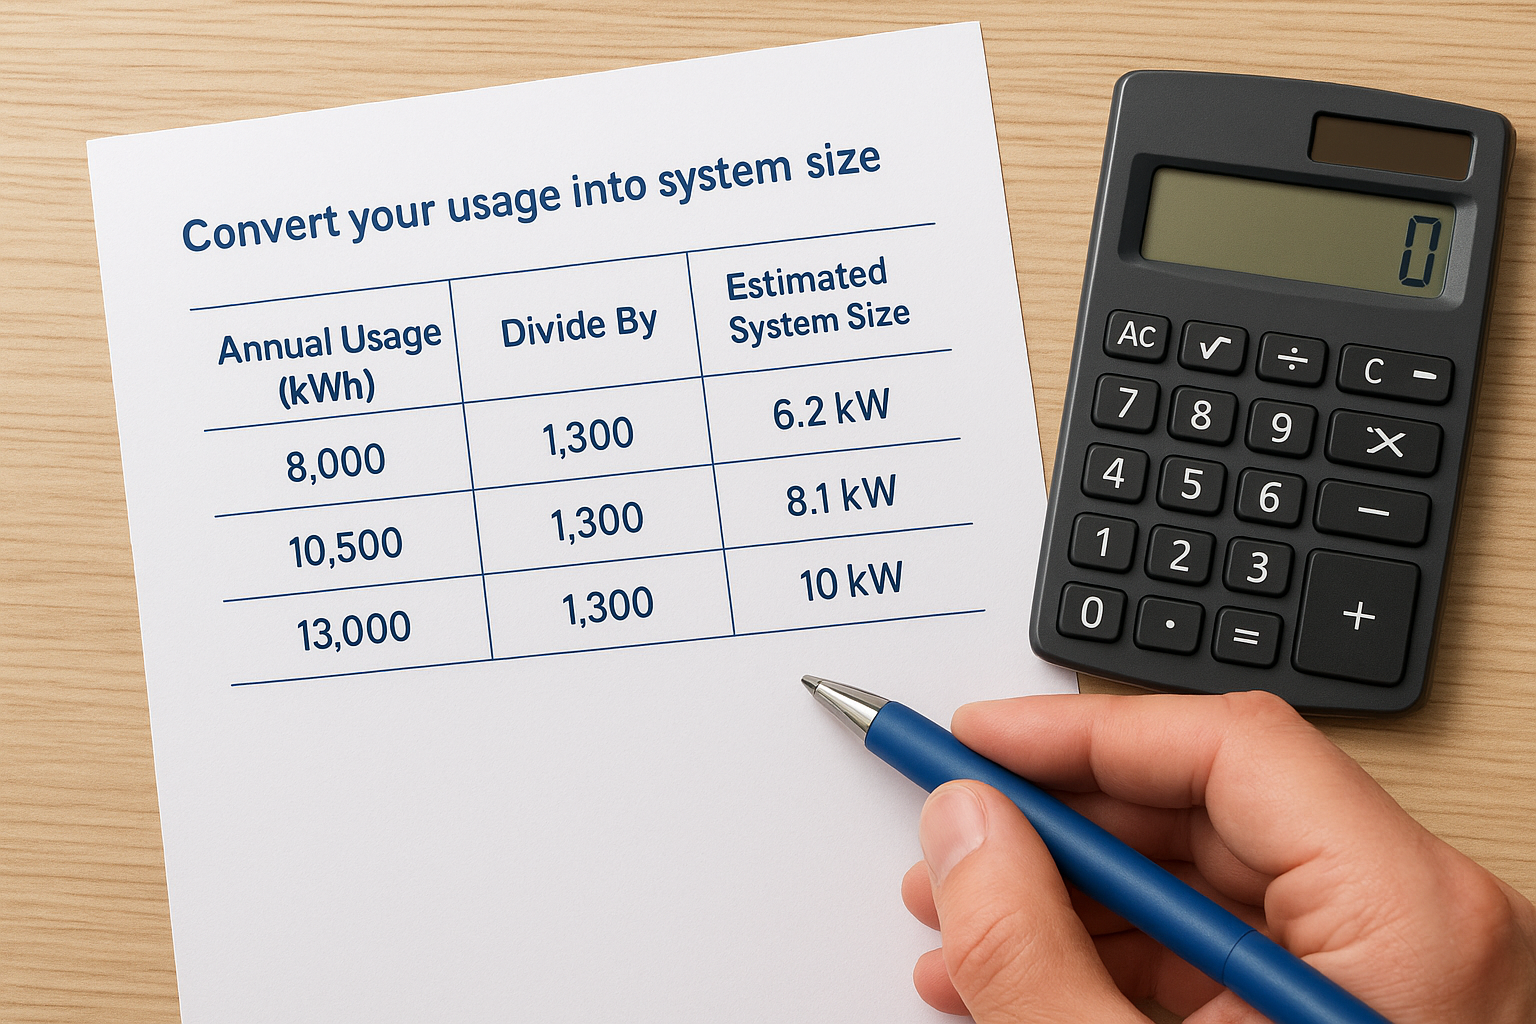
| Annual Usage (kWh) | Divide By | Estimated System Size |
|---|---|---|
| 8,000 | 1,300 | 6.2 kW |
| 10,500 | 1,300 | 8.1 kW |
| 13,000 | 1,300 | 10 kW |
Your local sun hours affect actual output, so treat these as working estimates rather than exact figures. They are precise enough to evaluate quotes and catch anything that looks significantly out of range.
Apply the price-per-watt to build your cost estimate
With your system size determined, multiply your kilowatt figure by 1,000 to convert it to watts, then multiply by the current price-per-watt benchmark for your region. At the 2026 national average of $3.00 per watt, an 8kW system runs about $24,000 before incentives. Running this calculation takes two minutes, but it immediately tells you whether a quote falls within a reasonable range. Your solar panel installation cost estimate at this stage won’t be exact, but it gives you a specific number to bring into any installer conversation rather than relying on whatever figure they present first.
How incentives and tax credits lower your price
Federal and state incentives directly reduce the total solar panel installation cost you pay, and they can cut your pre-incentive price by 30% to 50% depending on where you live. Most homeowners focus on the panel price and overlook these programs entirely, which means they either overestimate what they’ll owe or fail to claim money they’re entitled to. Understanding the available programs before you sign a contract helps you structure your financing around your actual net cost rather than the gross figure on the quote.
The federal solar investment tax credit
The federal Investment Tax Credit (ITC) currently covers 30% of your total installed system cost, including panels, inverter, wiring, mounting hardware, labor, and permits. This is a dollar-for-dollar reduction of your federal income tax liability, not a deduction. If your system costs $22,000, the ITC gives you $6,600 back directly on your tax bill, provided you owe at least that amount in federal taxes for the year. If your tax liability is lower than the credit amount, the remaining balance rolls forward to the following tax year.

The ITC applies to the full installed cost, so every dollar you spend on a quality system also increases the credit amount you receive.
You claim the ITC by filing IRS Form 5695 with your federal return for the year your system is placed in service. Your installer should give you a final invoice that itemizes all eligible costs, and you pass that total to your tax preparer. The credit is available for both purchased systems and systems financed through a solar loan, but it does not apply to leased systems or power purchase agreements, since the leasing company claims the credit instead.
State incentives, rebates, and utility programs
State-level programs vary significantly, but many states layer additional savings on top of the federal credit. Some states offer a direct percentage-based state tax credit, which works the same way as the ITC but applies to your state income tax bill. Others provide upfront rebates paid directly to your installer, which reduce the total invoice amount before financing even begins.
Many utility companies also run net metering programs that credit you at the retail electricity rate for excess power your system sends back to the grid, which reduces your ongoing monthly bill and shortens your payback period. Check your state’s utility commission website for current net metering rules in your area, since the rates and credit structures differ by utility.
How to judge ROI, savings, and payback
Once you know your net cost after incentives, you can calculate whether solar makes financial sense for your specific situation. Return on investment (ROI) and payback period are the two numbers that matter most, and both require only basic math to figure out. The goal is to compare what you spend today against what you save on electricity over the next 20 to 25 years.
Calculate your simple payback period
Your simple payback period tells you how many years it takes for your cumulative electricity savings to equal your net system cost. To find it, divide your net installed cost (after the federal tax credit and any state incentives) by your estimated annual electricity savings. For example, a $22,000 system with a $6,600 federal tax credit leaves you with a net cost of $15,400. If that system saves you $1,600 per year on electricity, your payback period runs about 9.6 years.
| Net System Cost | Annual Savings | Payback Period |
|---|---|---|
| $12,000 | $1,400 | 8.6 years |
| $15,400 | $1,600 | 9.6 years |
| $18,000 | $1,800 | 10 years |
Most residential solar systems carry a 25-year production warranty, which means you have 15 or more years of essentially free electricity after your system pays itself back.
Electricity rates have risen an average of 2 to 3% per year historically, which means your annual savings grow larger with each year your system operates.
Estimate your lifetime savings
Your lifetime savings figure accounts for rising electricity costs over the system’s life, making it a more accurate picture of your real return than the payback period alone. Multiply your first-year savings by the number of years remaining after payback, then layer in an annual electricity rate increase of 2 to 3%. A system that saves $1,600 in year one could save $2,200 or more by year 20 as utility rates climb.
Comparing your total solar panel installation cost against this projected savings figure gives you the full return picture. Most homeowners who own their systems outright see a lifetime return of $30,000 to $60,000 over 25 years, depending on system size, local electricity rates, and how much your utility charges increase over time. That range makes solar one of the strongest long-term home investments available.
A simple way to get a firm price
Every number in this guide gives you a solid foundation, but your actual solar panel installation cost depends on your specific roof, energy usage, and location. No benchmark replaces a real quote from an installer who has seen your property. The fastest way to move from estimates to a firm price is to schedule an on-site inspection where a professional measures your roof, reviews your utility bills, and accounts for any factors that affect your final cost.
Sunflowers Energy LLC offers free, no-obligation on-site inspections for homeowners in our service area. We handle both roofing and solar, so we catch roof conditions upfront that could affect your installation timeline or cost, before they become surprises mid-project. You leave the appointment with a detailed quote you can compare against anything else you receive. Schedule your free solar inspection with Sunflowers Energy and get a real number you can build your decision around.

2 Responses